

Map in Matlab
Explore maps in Matlab and see how this feature makes it simple to work with complicated datasets. We can easily retrieve and manage important information if we know how to make, populate, and access maps.
In a variety of disciplines, from geographic research to data visualization, creating maps that are both aesthetically pleasing and educational is crucial. Powerful capabilities for creating maps and visualizing spatial data are available in MATLAB. In this context, we will explore how to create a fancy map of a specific area in MATLAB.
By specifying the longitude and latitude bounds of the desired area, we can generate a map that focuses on the region of interest. We can also customize the map appearance by adding grid lines, labels, and other elements. Additionally, we can fill the land area with a specific color to enhance the visual representation.
With the help of the Mapping Toolbox in MATLAB, we can seamlessly integrate geographical data, such as coastlines, into our maps. As a result, we can add further details, like borders or data points, to the model to provide insightful information.
We may produce compelling maps that successfully represent geographic information for a variety of applications, such as research, presentations, and publishing, by utilizing MATLAB's capabilities.
So, let's dive into the realm of map in Matlab and unlock the true power they offer for streamlined data management and analysis
Code to Perform Map in Matlab
Below is an example of matlab code to create a map for certain area or region. in this case, we will create my lovely country Indonesia. Here is the code.
clear all;
clc;
% Define the desired area bounds in longitude and latitude
lon1 = 95; % Starting longitude
lon2 = 141; % Ending longitude
lat1 = -11; % Starting latitude
lat2 = 6; % Ending latitude
% Create a new figure
figure;
% Create a world map
ax = worldmap([lat1 lat2], [lon1 lon2]);
% Fill the land area with a certain color
land = shaperead('landareas', 'UseGeoCoords', true);
geoshow(ax, land, 'FaceColor', [0.66, 0.66, 0.66]); % Replace 'green' with the desired color
% Customize the map appearance, such as grid lines, labels, and title
grid on;
mlabel on;
plabel on;
title('Map of a Certain Area');
% Add any other desired plot elements or data
% Save the figure (optional)
% saveas(gcf, 'map.png');
% Show the map
By running the code, you'll get a map like this:
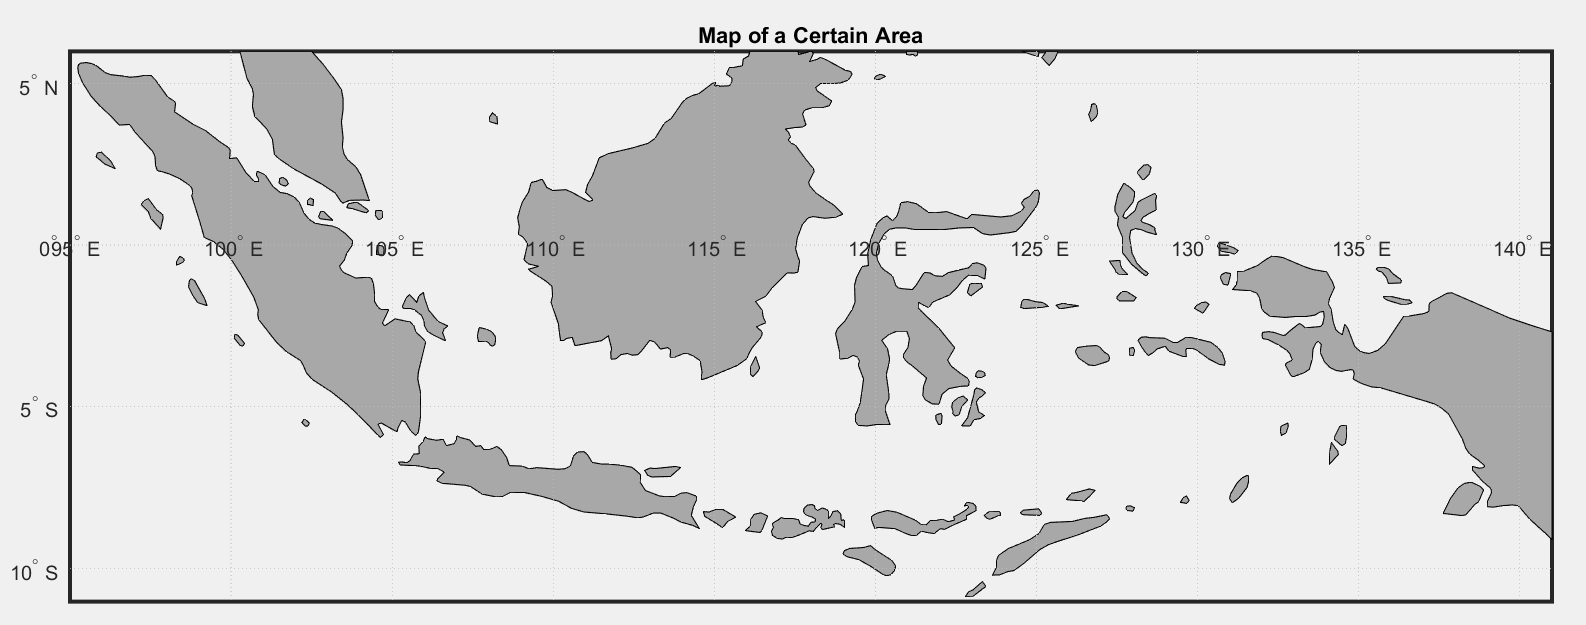
Wow, its Awesome! isn't it?
Feel free to modify as you need.
In the code above, we use the worldmap function to create a world map with the specified area bounds. The shaperead function is then used to load the land area shapefile, and the geoshow function is used to fill the land area with the desired color.
Please make sure you have the Mapping Toolbox installed and that you have the appropriate shapefile data for the land areas.
wait, you can even change the land color by using matlab color library. Below is colors in Matlab and how to specify using RGB values:


what you have to do is just to change the value in the square bracket after the 'FaceColor' in the geoshow function. just it ! Keep practice to master it for your study or research purposes.
this is our first map. for advance, But, for researcher, student, or those who work or studies in the field of earth sciences, I'm suggest you create a map containing the bathymetri or topography data for the better result and interpretation. Here, i'll give you the example in Matlab how to create it.
For better understanding in plotting a map in Matlab, here are some external links that provide information and tutorials about maps in MATLAB:
1. MATLAB Documentation - Map Containers: Link: https://www.mathworks.com/help/matlab/map-containers.html
Description: The official MATLAB documentation on map containers, providing detailed explanations, examples, and usage guidelines.
2. MATLAB Mapping Toolbox: Link: https://www.mathworks.com/products/mapping.html
Description: Explore the Mapping Toolbox, an add-on product for MATLAB that provides advanced mapping and geospatial capabilities.
3. MATLAB Central File Exchange - Mapping and GIS: Link: https://www.mathworks.com/matlabcentral/fileexchange/?term=mapping
Description: The MATLAB Central File Exchange hosts various user-contributed mapping-related scripts and functions.
4. Geospatial Data in MATLAB: Link: https://blogs.mathworks.com/steve/2009/10/08/geospatial-data-in-matlab/
Description: A blog post by Steve Eddins from MathWorks, demonstrating how to work with geospatial data in MATLAB.
5. Mapping Toolbox™ User's Guide: Link: https://www.mathworks.com/help/pdf_doc/map/map_ug.pdf Description: A comprehensive user's guide for the Mapping Toolbox in MATLAB, providing in-depth explanations and examples.
Create a Map Containing the topography and Bathymetri Data
Assuming that you have installed m_map in your Matlab programs and the ETOPO file.
Note: Find other articles in this site to find out how to install m_map in Matlab programs here.
Here the code:
m_proj('miller','lon',[105 115],'lat',[-15 -7]); %this is for the region of South of Java Indonesia
[el, lg, lt] = m_etopo2([105 115 -15 -7]);
m_grid('linewi',2,'tickdir','out');
hold on;
m_pcolor(lg, lt, el);
shading interp; % To get smooth color gradients
colorbar; % Add a colorbar to show the depth scale
colormap(jet); % Use the 'jet' colormap for coloring the bathymetric map
caxis([-3000 0]); % Set the color axis limits to match the bathymetric data range
By running this code you will get result like this:

m_proj('miller','lon',[105 115],'lat',[-15 -7]);
[el, lg, lt] = m_etopo2([105 115 -15 -7]);
m_grid('linewi',2,'tickdir','out');
hold on;
m_contour(lg, lt, el, [0 -40 -200 -500 -1000 -3000],'color', 'black','linewi',1);
in the code above, we only plot the topography/bathimetry of 0, 40, 200, 500, 1000, and 3000 m
and this is the result

now, try yours ...
-asb, founder of myresearchxpress
#GeographicVisualization
#DataMapping
#VisualizeGeodata
#GISinMATLAB
#MapVisualization
#GeospatialData
#DataVisualization
#MapTutorial
#MATLABGIS
Tags:
matlab